When you're trying to figure out why your web app is running slowly, it can be pretty frustrating to switch between different tools that don't really work together. You might use Chrome's performance panel to see what functions are being called, then jump over to Angular DevTools to understand what's happening with your components. But having to use two separate tools makes it hard to get the full picture of what's going on.
(Source: Angular)
This problem gave the Angular and Chrome teams a great idea - why not bring Angular-specific information directly into Chrome DevTools? So they worked together to create a unified way to profile Angular applications. Now there's a new custom track for Angular right inside Chrome DevTools.
This integration means you can get the best of both worlds - detailed performance data combined with Angular concepts you already understand.
Getting to know the new custom track
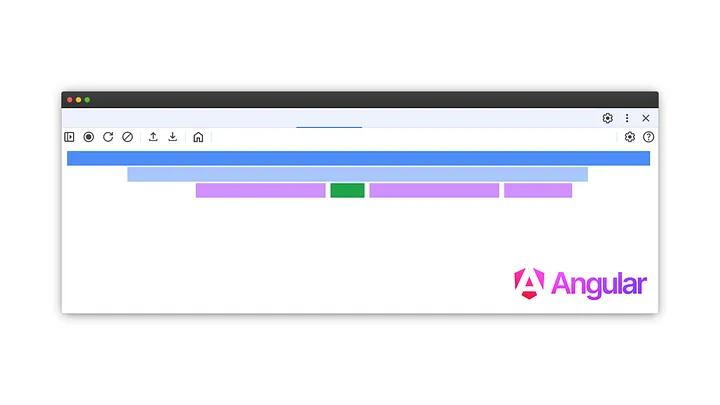
With this new feature, you'll see performance data organized around Angular concepts that make sense to you, like application startup, components, UI updates, and lifecycle hooks.
(Source: Angular)
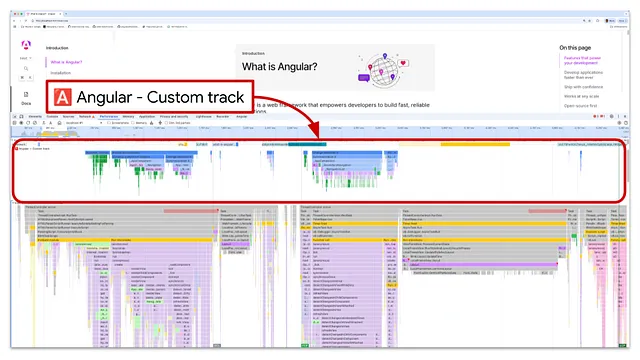
The custom track uses flame charts that group function calls together under their related components and other Angular concepts. You can zoom in to see individual functions when you need the details, but you can also step back and understand the bigger picture from the groupings.
(Source: Angular)
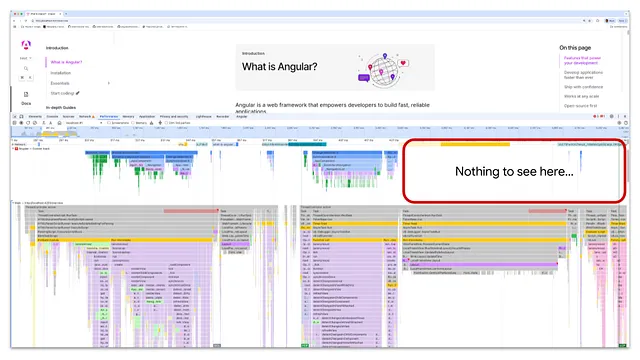
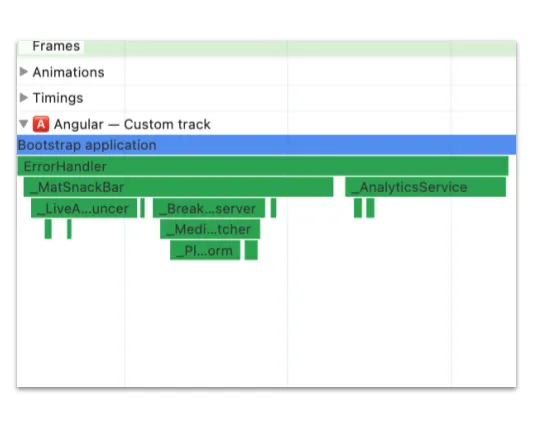
One of the best parts is that you can easily tell the difference between your application's code, other scripts running on the page, and browser activities like layout and paint operations.
Decoding the colors: what your code is doing
The flame chart uses different colors to help you quickly understand what's happening in your application.
Green bars: These show Dependency Injection (DI) services that are created when your application starts up. Generally, green means code that you wrote as the application developer.
(Source: Angular)
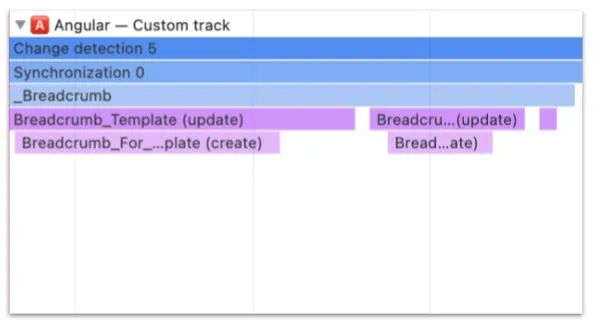
Purple color: This color is used for templates that Angular has compiled. Even though it's still your code, Angular has transformed it before it runs in the browser. This helps you see which templates are creating or updating the DOM and how long these operations take.
(Source: Angular)
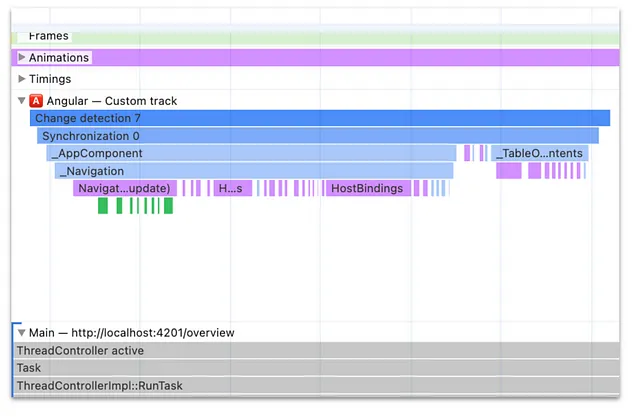
Various shades of blue: These mark the entry points - basically, they show why Angular decided to run your application code in the first place. The blue bars represent all the components that need to do work, which is really helpful for understanding how user interactions affect DOM updates. Under component names, you'll see the familiar purple (templates) and green (your component code).
(Source: Angular)
Since the custom track is interactive, you can click on any entry in the flame chart to see more detailed information about what happened. This gives you the power to dig deeper into specific function calls and understand how they affect your application's performance.
How to get started
Setting up this powerful new feature is pretty simple. Just follow these steps:
Make sure you're using the latest version of Angular (v20 at the time of writing this) and an up-to-date version of Google Chrome.
Run your Angular application in developer mode.
With your application running, open Chrome DevTools and enable the custom track by typing
ng.enableProfiling()in the console.Once it's enabled, start recording a performance profile. You'll see the dedicated "Angular" track in the flame chart.
Check out the Angular documentation for more details on how to configure and set everything up.
More performant apps are on the way
This new integration with Chrome DevTools shows how committed the Angular and Chrome teams are to making development easier and more productive. By providing tools that give you focused and actionable insights, they're helping developers build faster, more efficient applications. Give this new integration a try and let the teams know what you think!

